今天才发现sublime可以直接编译我我我……
find({needName:needValue},{showType:showValue})
上次作业的清洗可以简化为1
2
3
4for i in item_info.
find({'pub_date':{'$in':['2016.01.12','2016.01.14']}),
{'area':{'$slice':2},'_id':0}:#id:notshow
print(i)
date1
2
3
4
5
6from datetime import date,timedelta
date(2016,02,02)
days = timedelta(days=1)
while the_date <= end_date:
yield (the_date.strftime('%Y.%m.%d'))
the_date = the_date + days
模板
1 | options = { |
#AIM
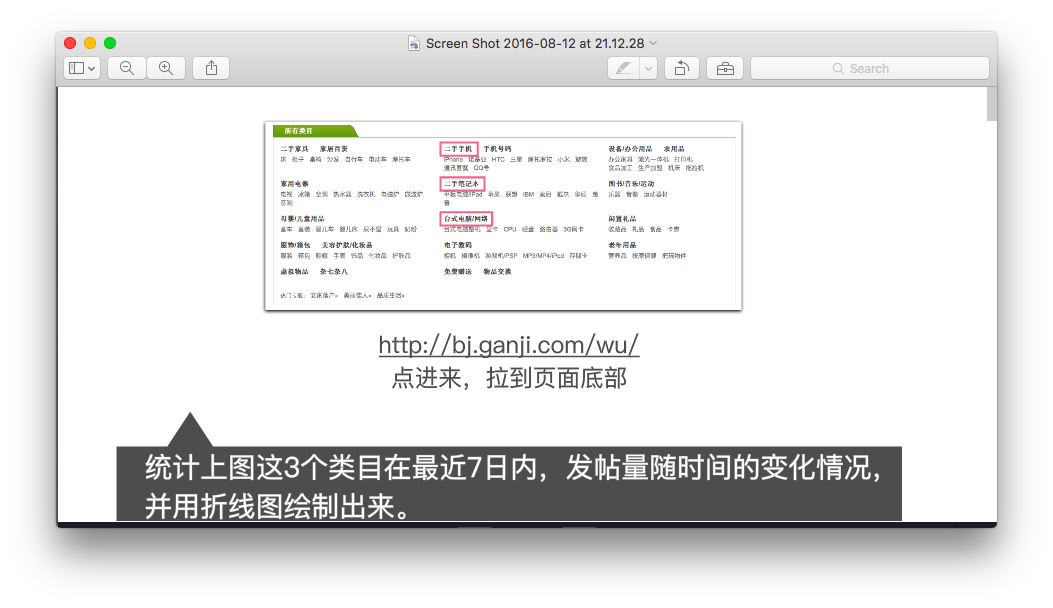
依旧用现成数据库数据吧..
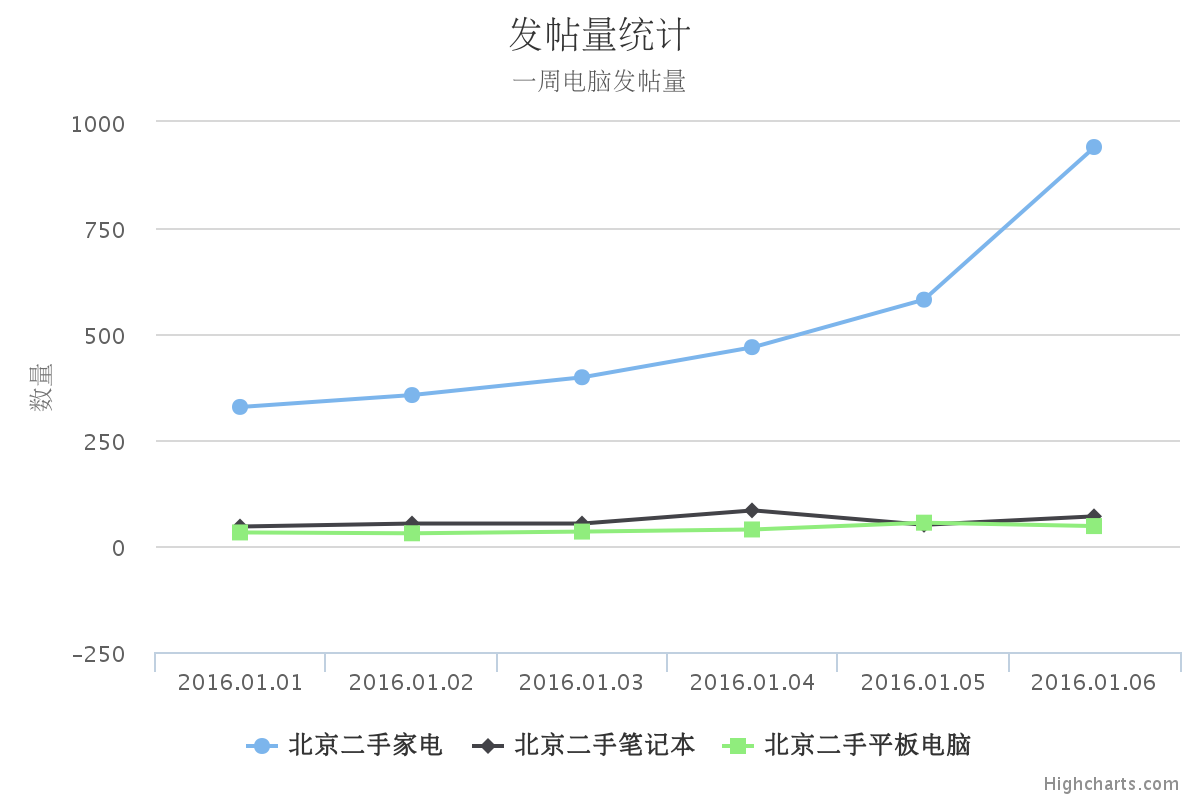
Results